
Pareto chart analysis is a graphical statistical technique, which is used to map and rank various issues of businesses ranging from the popular ones to the least popular ones. The identification of Pareto analysis depends upon the factors that generate good impact. To do this, you have to apply the Pareto principle, also called as 80/20 rule.
A Pareto chart is the type of graph that includes lines and bars; one sidebar represents the value in descending order, and a line representing the cumulative sum. The Pareto principle was named after Vilfredo Pareto, who was a renowned Italian economist.
Pareto analysis is applied in a simple and straightforward way and helps in prioritizing problem-solving. This is done in a way that the first part helps to resolve number problems. Primarily, the Pareto principle is based on the 80/20 principle, which defines that 80% of the problems may be caused by only a few as 20% of the cause. To analyze these stats, you need to list all problems and then have to score and map every single problem; once done, summarize the group score.
At this stage, you should know about the issues and then work according to the problem. The analysis will help in identifying the issue; with its rating system, you can easily identify the problems.
Easy spreadsheet program, advanced software tools, and the online quality chart helps generators create the maps.
Pareto Principle Analysis:
Also known as the 80/20 Pareto Principle, this law states that 20% of the population helps to control 80% of the overall income. You can use this to evaluate most of the things in life and are not equally distributed. In simple terms, the 80/20 principle also means that 20% of the input will give 80% of results.
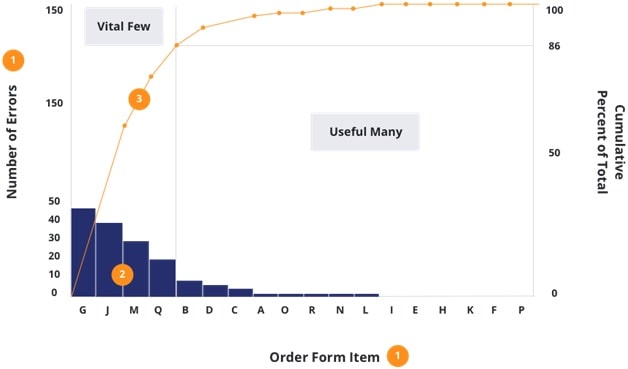
The vital few:
The limited number of resources is responsible for most of the issues.
The useful many:
Most of the resources account for just a small portion of the overall problem. If there isn’t any midpoint between the useful many and vital few, that situation is called an awkward zone. When identifying the issues, the best thing is to focus on the vital few than the useful many.
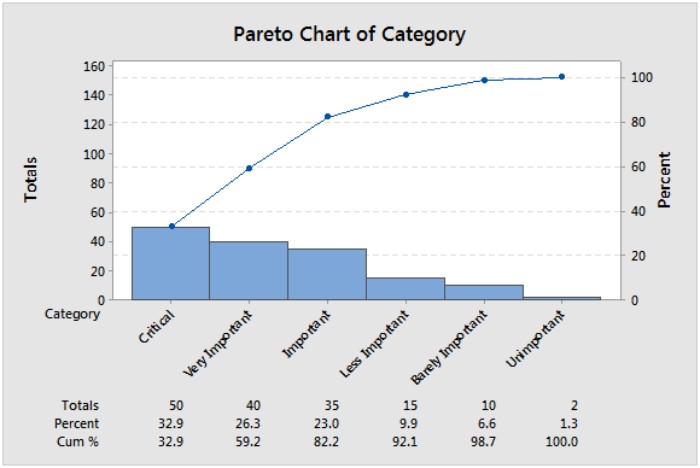
In this, the Pareto diagram is useful and helps in identifying the important source of the quality problems by ranking the influence of various factors on that particular effect. A well-constructed Pareto diagram and tables, irrespective of their format, is made of three basic elements:
- The total effects of contributors that are ranked by the extent of their contribution
- The magnitude of each contributor contribution
- The cumulative percent of the total impact on the contributor
The six diagram deployment plan:
The use of a Pareto diagram is the analytical method of counting and charting the frequency and severity of the problems that have occurred. The solutions related to such problems help in detecting various issues related to business, products, and the quality of its concerns.
This principle will help to state a small number of issues, which are responsible for various problems and issues. The ranking is another factor that is conducted by the businesses, who have information to provide a ranking of every serious problem. You should also keep in mind how this area will impact the cost of the quality into manufacturing as their main issue.
Origin of Pareto chart:
The Pareto chart comes from Paret of the principle, which a Romanian-born American management consultant, Joseph Juran, during the Second World War. Pareto, the name was given by Italian economist Vilfredo Pareto. The prime purpose of this principle is to separate various aspects of the problems from the major ones. By separating both, you can have a better idea of where the issue needs improvements. Minimizing the large bars of the Pareto diagram, you will be able to make improvements in the businesses.
You can analyze Pareto in two ways:
- Counts Parteo: In this, you will learn in which category there is an issue. For this, you need to do counts, and for the counts, you have to know all categories and how often such categories occur.
- Cost Pareto: In this, if you want to identify the category that is causing more issues and wants to know which one is expensive in terms of cost, you can use Pareto to get details of everything. Let’s consider this with an example: you have 50 occurrences of one issue and 3 for another issue; using Pareto, you can tackle this issue that has occurred around 50 times than the one that has occurred three times.
Moreover, if the issue that occurs at 50 times costs around $.50 per occurrence and the issue has occurred three times, it will cost $50 each time. Depending upon its value, you will be able to handle the expensive issue at first.
The procedure of the Pareto chart:
Here are few things that you should keep in mind when using the Pareto Chart:
- The category that you are using for different group items
- The measurements that are important and are common like time, cost, frequency.
- An overall period that the Pareto will cover like one week cycle of a full day
- Get all data, the recordings of the category, and get data that you are already using.
- Total of all categories measurements
- The appropriate scale of the measurements that you have collected
- Labeling and construction of bars of each category
- Calculating the percentage of every category
- Drawing and labeling on the vertical axis
- Measuring the cumulative sum and adding the subtotal of every category
What are the advantages of the Pareto chart:
- Pareto helps in identifying the root cause of the problem
- It helps in prioritizing the main issue and trying to eliminate it
- Showing the idea of the total impact on the issue
- With Pareto, you can plan and correct the issue
- It gives a clear, simple, and focused idea of identifying the important issue
- Useful in the leadership
- Helps in the time management
- Pareto is used in planning, analyzing, and troubleshooting the issues
- Helps in a change of time management and change management