
Business Intelligence (BI) is a crucial technology for any business. With the enormous amounts of data generated by this technology-driven world, it’s more important for any business to have the right tools to analyze that data and get insights.
When it comes to business intelligence tools, there are a variety of options available. But the two most popular BI solutions in the market today are Tableau and Microsoft Power BI.
Tableau and Power BI are two excellent business intelligence tools that have been making waves in the business world.
Tableau is a software tool for creating data visualizations, while Power BI is a cloud-based service to analyze and share your data. But which one should you use?
To get the answer to this question here, we have compared Tableau vs Power BI, so read further to know which one is the best…
What is Power BI?
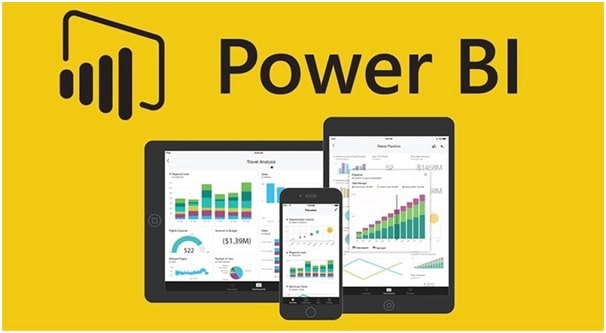
Image Source: ArcherPoint
Power BI is a cloud-based service that enables you to create data visualizations, reports, and dashboards. Not only does it allow users to aggregate their own data, but also the public Microsoft dataset, which includes various company insights ranging from Twitter followers of specific companies or how many bikes are rented at Capital Bikeshare in Washington D.C.
One of the exceptional features of Power BI is that it offers a plethora of different connectors to import your data. These connectors include services such as Salesforce, Google Analytics, MailChimp, Facebook, and more.
You can also connect to various databases, including SQL Server, Oracle, and MySQL. Once your data is imported, you can start creating visualizations, including bar, line, and pie charts. Additionally, Power BI allows you to create dashboards where you can include various visualizations together on one page.
If you are pondering about using the Power BI tool, then you must get connected with Microsoft Power BI consultants to get innovative Power BI Solutions. By doing so, you can make efficient use of this Business Intelligence tool.
What is Tableau?

Image Source: PR Newswire
Tableau is software used by data analysts who want to explore huge amounts of data in order to discover trends or patterns that will help them make better business decisions. Tableau is different from other business intelligence (BI) tools because it allows users to create visualizations that are extremely interactive.
Tableau was created by two guys who were working at Microsoft and decided they wanted to make data analysis easier for everyone. And that’s exactly what Tableau did – it made data analysis easy enough for anyone to do.
One of the outstanding things about Tableau is that it offers a free trial, so you can try it before you buy. Additionally, there are many different tutorials available online to help you get started with Tableau.
Pros and Cons of using Power BI and Tableau
Here I have stated some pros and cons of using Power BI and Tableau.
Pros of using Power BI
– Create reports and dashboards in minutes.
– Connect to various databases, spreadsheets, and cloud services such as Google Analytics or Salesforce.
– Free trial available so you can try before you buy!
Cons of using Power BI
– Limited to creating data visualizations and reports.
– Cannot connect to proprietary databases without purchasing a license.
Pros of using Tableau
– Extremely interactive visualizations.
– Can connect to a variety of different data sources.
– Free trial available so you can try before you buy!
Cons of using Tableau
– Can be difficult to understand for those who are not familiar with data analysis.
– More expensive than Power BI.
Similarities Between Power BI and Tableau
Both Power BI and Tableau offer the ability to create dashboards with various visualizations together.
They can both be used to explore huge amounts of data in order to discover trends or patterns that will help businesses make better business decisions.
Both tools offer a free trial, so you can try them out before deciding which one is best for you. Additionally, they are both very interactive and allow users to connect to a variety of different data sources.
Difference Between Power BI and Tableau
The primary difference between Power BI and Tableau is that while Power BI allows you to create reports, dashboards, and data visualizations, Tableau allows users to explore huge amounts of data in order to discover trends or patterns.
Tableau is also more difficult to understand for those who are not familiar with data analysis. Additionally, Tableau is more expensive than Power BI.
Power BI vs Tableau: Which One is More Popular?
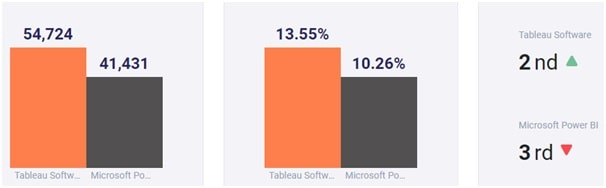
Image Source: Slintel
According to Slintel, current Tableau has a market share of 13.55%, with 54724 customers utilizing it, whereas the Power BI tool has a market share of 10.26% with 41431 users.
Power BI launched 12 years later than Tableau (in 2015); after that also it has rapidly achieved market share thanks to its ease of use & Microsoft credentials.
Moreover, if I talk about category ranking, then Tableau Software stands at 2nd place by ranking, while Microsoft Power BI is at 3rd place.
Tableau vs Power BI: Which One To Pick?
Image Source: Skelia
Here I have compared a few parameters which will help you decide which BI tool is better for you.
1. Pricing
Tableau is more costly than Power BI. Tableau offers a free trial as well as three different pricing plans. The Personal edition and Professional edition are two plans, and both have different pricing. There are also Enterprise editions that give you access to more advanced features.
Whereas; Power BI has a free basic plan that lets you connect to one data source and gives you access to some basic features like visualizations built on existing reports or dashboards embedded into your own webpage. For more advanced options, there are three paid plans available.
2. Ease of use
Power BI is much easier to use than Tableau. It has a clean and instinctive user interface, while Tableau can be quite complex for beginners.
3. Features
Power BI offers more features than Tableau. For example, it has built-in support for natural language processing (NLP), making data analysis easier. It also has more templates (e.g., Tableau has only one dashboard template).
4. Integrations
Power BI can integrate with many other business applications like Salesforce, LinkedIn, and Twitter. It also offers integration with Microsoft Office products such as Excel, Word, Sharepoint, etc., which Tableau does not offer.
On the other hand, Tableau offers better integration with databases like MySQL and PostgreSQL.
5. Data Visualization
Tableau is the better tool for data visualization. It offers more options for customization and has a wider range of chart types.
Power BI’s data visualizations are not as customizable, and it has a limited number of chart types.
6. Community
Power BI has a much larger community than Tableau. This means that there are more resources available online (e.g., videos, tutorials, etc.) to help you learn how to use Power BI.
Moreover, if in case you need more help using the Power BI tool, then you can avail Power BI Consulting Services to get support in Power BI Development.
7. Programming Tools Support
Tableau offers better support for programming tools than Power BI. If you want to write code to manipulate your data, Tableau is the better tool.
Moreover, Tableau has an open platform that allows you to create your own custom applications.
8. Usability
Tableau’s user interface can be confusing for beginners because there are so many options to choose from, and it can be hard to know which one to select. However, Power BI is much easier to use and has a simpler user interface.
9. Ease of Deployment
Tableau makes data analysis easy with its in-memory technology, which gives you immediate access to your data without having to wait for a long time.
On the other hand, Power BI needs slower disks that have low latency times so you can get quick access to your data.
10. Compatibility
Tableau and Power BI both work on Windows, macOS, and Linux. However, if you want mobile app versions of these tools, so you can use them on the go (e.g., iOS or Android), then Power BI is better suited for this purpose because it offers native Power BI mobile apps.
11. Data Connectivity
Tableau does not work with Microsoft Office files, while Power BI supports a wide range of formats such as Excel and Word docs (.xls/.xlsx). In addition, it also works directly with data from cloud services like Dropbox and Google Drive.
However, when it comes to databases, Tableau offers better connectivity with MySQL and PostgreSQL.
A tableau is a great tool for data analysis, but it’s better suited to experienced users. Power BI is easier to use and can work with larger datasets, which makes it more suitable for beginners in the business intelligence field.
Conclusion
Power BI is an outstanding tool for visualizing data, and Tableau has some cool features that you might not find in other tools. If you’re looking at either of these programs, we recommend looking at the pricing plans first to see which one will work well for your needs.
Moreover, you should also consider ease of use and programming support if those are important factors to you as well. The two products have different strengths, so it’s up to you to decide what works best for your company!
Additionally, if in case you require any support using Power BI or Tableau tool, you can hire Tableau or Power BI Developer from the best Tableau and Power BI service provider company. By doing so, you will be able to make efficient use of these two Business Intelligence tools.
Author Bio:
Kristi is an IT Consultant & Online Marketing Strategist with over five years of professional experience. She is currently working with India’s leading IT company ValueCoders which offers a wide range of IT services such as mobile app development, Power BI Service, web development, flutter, xamaring kotlin, and much more. She has spearheaded many successful campaigns for Valuecoders.